All the does are dry and we are waiting for kidding season to start in March. In 2025, we freshened 7 does and by the late summer, had the milkers reduced to just 4 remaining. For 2026, we are freshening those 4 again plus 3-2yo first fresheners and 3-yearling first fresheners for a total of 10 milkers.
2025 was our first year to do milk test and we did the Owner/Sampler (O/S 40) testing. This means we (Rob and Anna) did our own weighing and sampling but had an external verification test done. We figured it would be an easier way to get started. Now that we are done with the current year, we have decided to continue in 2026 on Standard Test. This means we will have someone else come to our farm every month to weigh the milk and take the samples. From a records perspective, being on Standard Test means the goats will qualify for more recognition in their pedigree documentation and can compete for things like Elite Lists and Top 10 production lists. So how did our numbers finish for 2025?
Breaking Down the Data
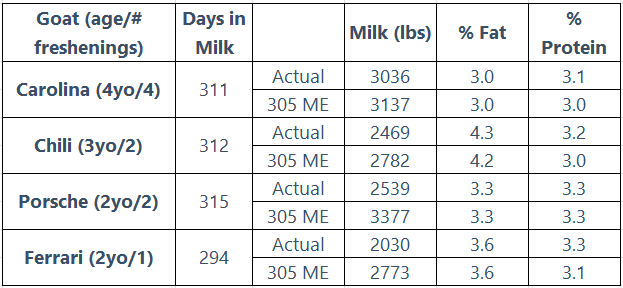
When you are doing milk test, samples are taken about every month (target 28-33 days). The labs that manage the data, have algorithms that fit your submitted data to existing curves or data sets. The more milk samples you take and submit, the better the fit of your data, and the more accurate your numbers. This is expressed as a Data Collection Rating (DCR) and there are minimum DCR values to qualify for things like the Elite list and Top 10.
The 305 ME is a 305 day lactation Mature Equivalent projection. It shows production adjusted for comparison purposes, most commonly:
- Age
- Lactation number
- Stage of lactation
- Milking frequency (2× vs 3×)
- Projection to a standard lactation length (usually 305 days)
Think of this as: “What this goat would be expected to produce if she were a mature animal in a full, standard lactation.”
In addition to the milk weight, the Fat % and Protein % are important considerations. Fat % indicates butterfat; influenced by genetics, fiber intake, rumen health. Higher Fat % is better for cheese making.
Butterfat is literally the cream in the milk.
Higher fat % means:
- Thicker cream line
- Richer mouthfeel
- Better butter yield
- Better ice cream texture
Protein % indicates milk solids and energy balance; often drops if nutrition is limiting. Protein — specifically casein — is what turns into cheese.
- Higher protein % = more cheese per gallon
- Two does with the same milk volume can produce very different cheese yields
Rule of thumb:
- +0.1% protein ≈ ~1% more cheese yield
Higher protein gives:
- Better curd set
- Firmer curds
- Less whey loss
- Better yogurt thickness
While protein makes curd, fat fills the curd.
Higher fat:
- Increases cheese yield per gallon
- Improves flavor development
- Produces a creamier, less brittle cheese
Best cheese milk = high protein + high fat, not just one or the other.
Final Summary
We have a solid milking herd. Carolina produced 353 gallons of milk in 311 days. Porsche is a rockstar and should continue to show higher production in the coming years as indicated by her 305 ME numbers. If we just want a batch of cheese, we should use Chili’s milk. Sticking with milk test should result in milk stars on pedigrees in most of our does. We learned a lot and will be sticking with it.